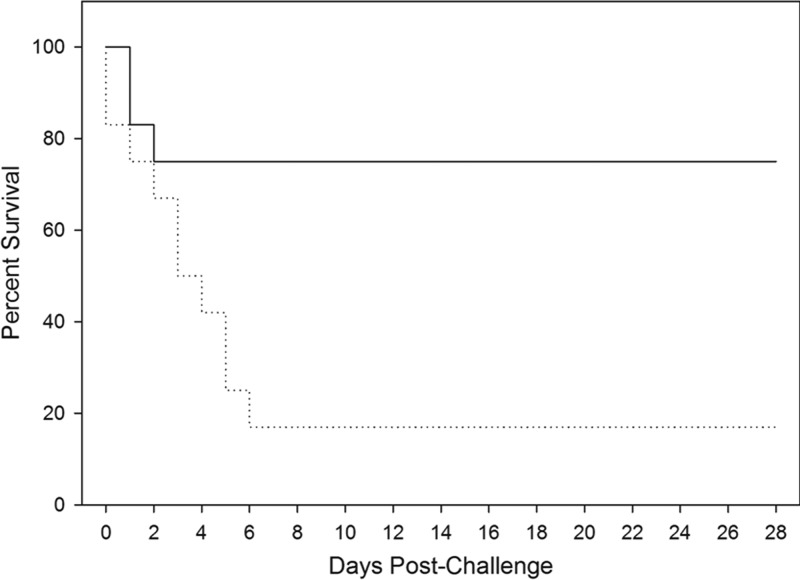
Fig 1.
Kaplan-Meier curves representing time to death from challenge and mortality data for each group. The time to death from challenge and mortality data for both challenged groups are shown. Solid line, group challenged with B. anthracis and then treated with antibody when ECL positive; dotted line, group challenged with B. anthracis and untreated.

