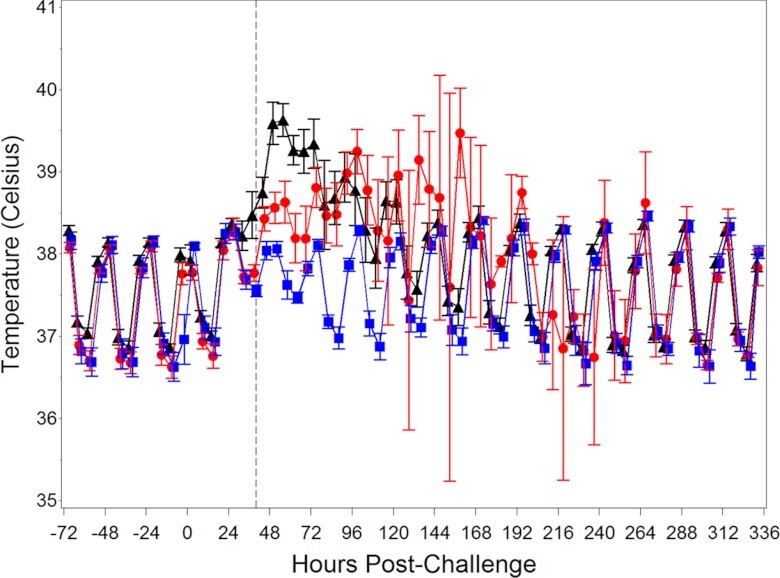
Fig 3.
Kinetics of body temperature for challenged and unchallenged animals. The mean body temperatures (± the standard errors of the mean) for B. anthracis-challenged and treated (black), B. anthracis-challenged and untreated (red), and unchallenged (blue) groups are shown. The dotted line represents the average time to treatment for treated animals.

