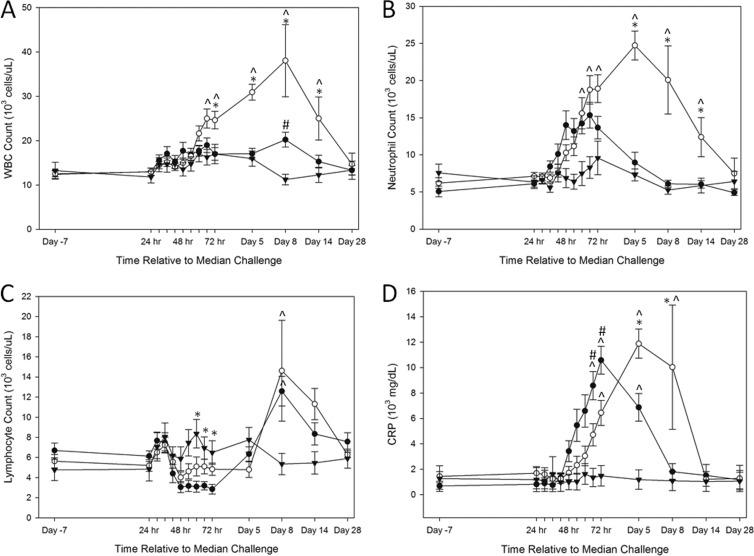
Fig 4.
Kinetics of clinical hematology and CRP for challenged and unchallenged animals. Average WBC count (A), neutrophil count (B), lymphocyte count (C), and CRP (D) trends are depicted for treated, untreated, and unchallenged animals. Closed circles, animals challenged with B. anthracis and treated with antibody; open circles, animals challenged with B. anthracis and untreated; closed triangles, unchallenged animals. Group averages with standard errors of the mean are shown. ^, P < 0.05 compared to the unchallenged group; *, P < 0.05 compared to the treated group; #, P < 0.05 compared to the untreated group.

