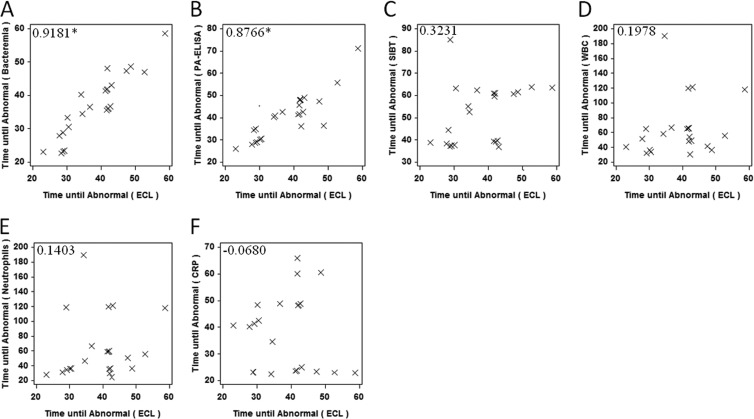
Fig 5.
Correlation for the onset of clinical parameters. The correlations for the onset for a positive/abnormal ECL with bacteremia (A), PA-ELISA (B), SIBT (C), WBC (D), neutrophils (E), and CRP (F) are shown in scatter plots. The correlation coefficient for each comparison is included. *, P < 0.05.

