
Fig 5.
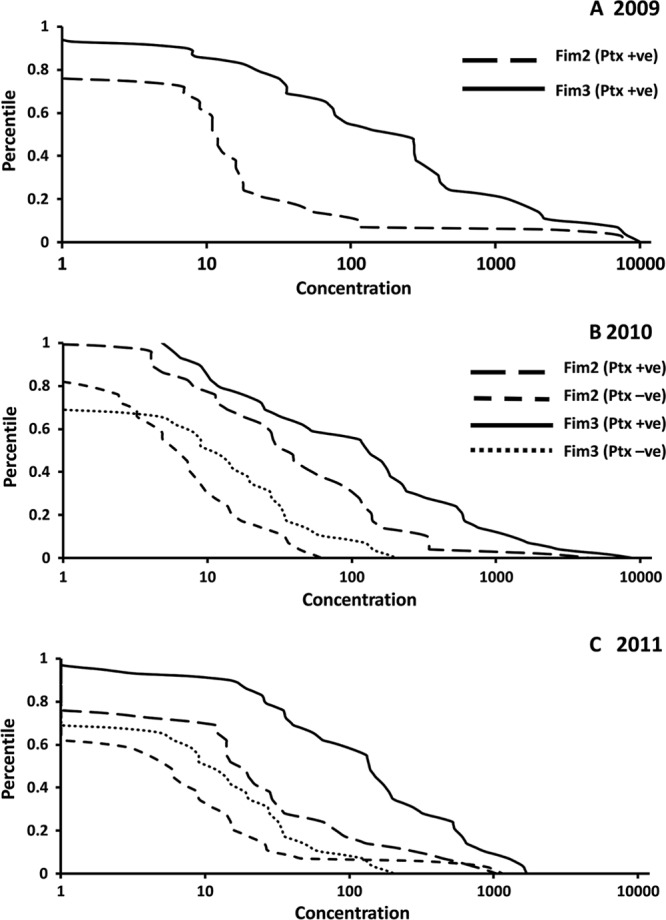
Reverse cumulative distribution curves of Fim2 and Fim3 ELISA IgG concentrations in sera from individuals seropositive or seronegative for pertussis by Ptx IgG ELISA (n = 30 per group) obtained in 2009 (A), 2010 (B), and 2011 (C).
Official websites use .gov
A
.gov website belongs to an official
government organization in the United States.
Secure .gov websites use HTTPS
A lock (
) or https:// means you've safely
connected to the .gov website. Share sensitive
information only on official, secure websites.
Reverse cumulative distribution curves of Fim2 and Fim3 ELISA IgG concentrations in sera from individuals seropositive or seronegative for pertussis by Ptx IgG ELISA (n = 30 per group) obtained in 2009 (A), 2010 (B), and 2011 (C).