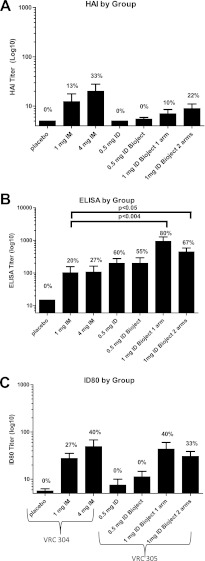
Fig 2.
Magnitude of H5 specific antibody responses. The responses determined by HAI assay (A), ELISA (B), and neutralization assay (i.e., the ID80) (C) are shown for all subjects (nonresponders and responders) by group in VRC 304 and VRC 305. Statistical differences are indicated. The frequency of responses meeting positivity criteria are printed on each graph for each group and assay.

