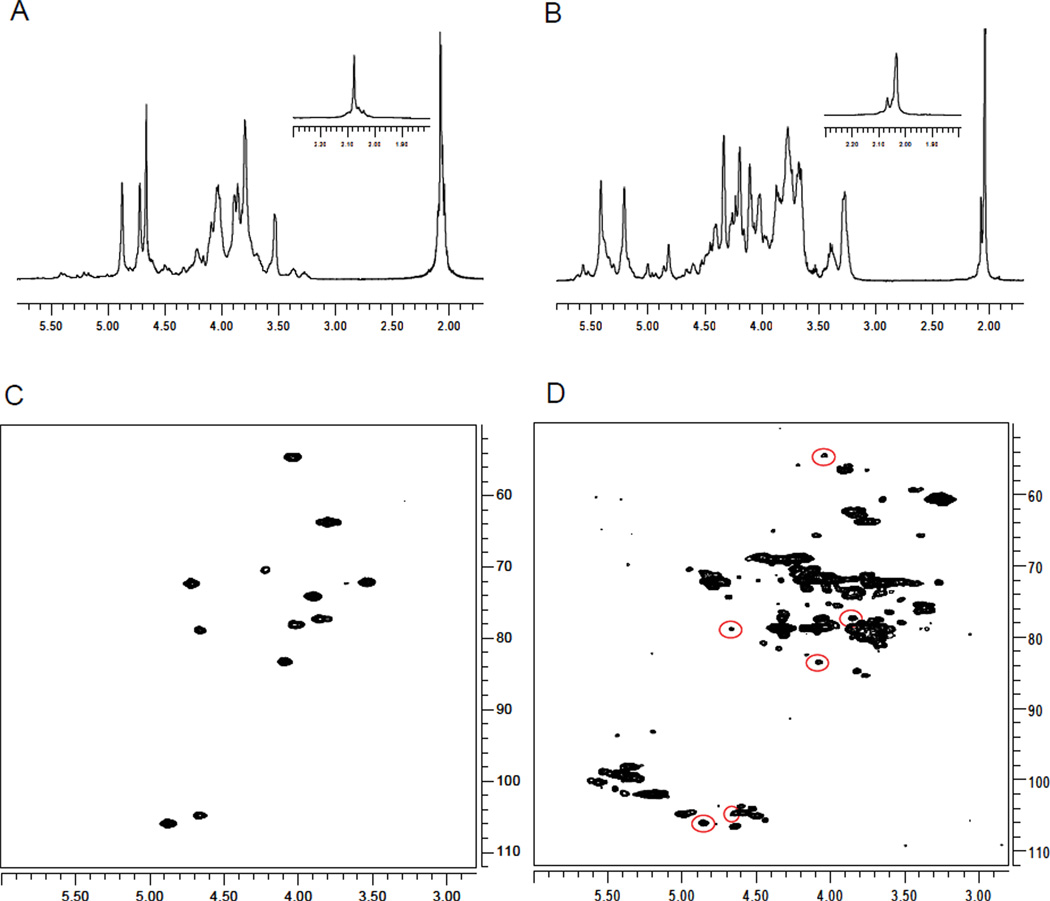
Figure 2.
Comparison between 1H-NMR spectra of (A) dermatan sulfate and (B) sample C2, which contains dermatan sulfate. Inset for panels A and B specifically shows the N-acetyl region of the spectrum. (C) HSQC spectra of dermatan sulfate and (D) sample C2. Peaks representative of dermatan sulfate are highlighted.

