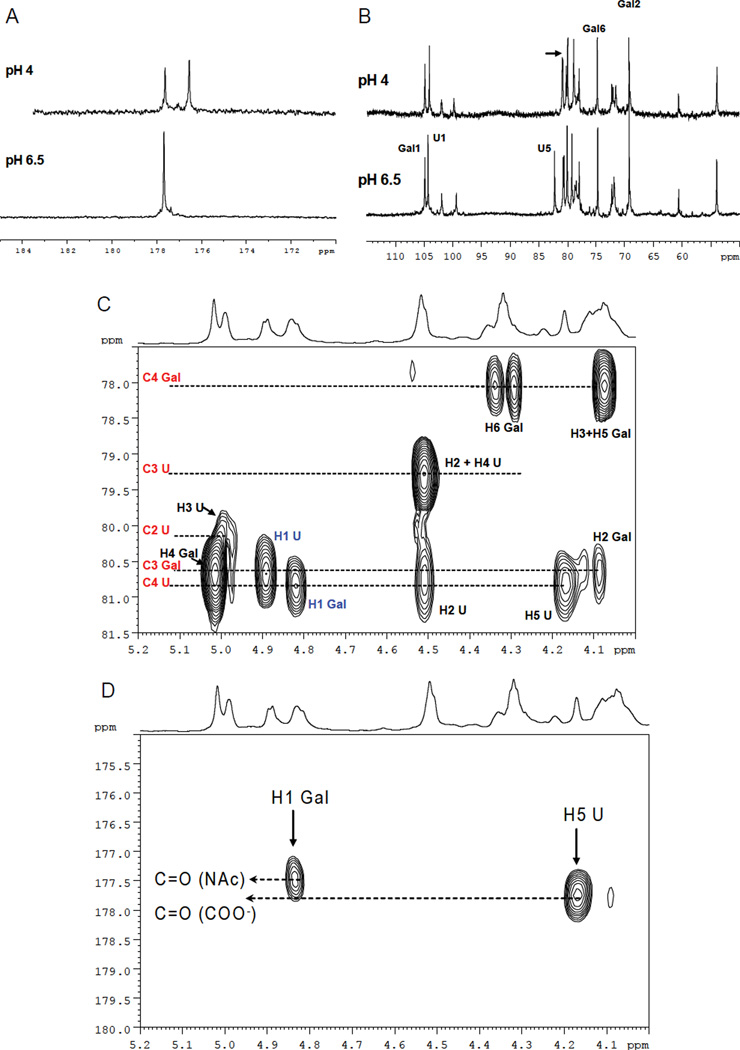
Figure 3.
(A) Carbonyl region of carbon spectrum of the contaminant measured at pH 6.5 and 4. (B) Sugar region of the carbon spectrum of the contaminant measured at pH 6.5 and 4. (C) A portion of 600 MHz HMBC spectrum of contaminant. Intramolecular two and three bonds proton-carbon correlations are shown in black; interglycosidic proton-carbon correlations are indicated in blue. (D) Portion of 600MHz HMBC spectrum of contaminant. Long range correlation between the H1 of Gal with C=O of the acetyl group and H5 of U with the carboxylic group are shown.

