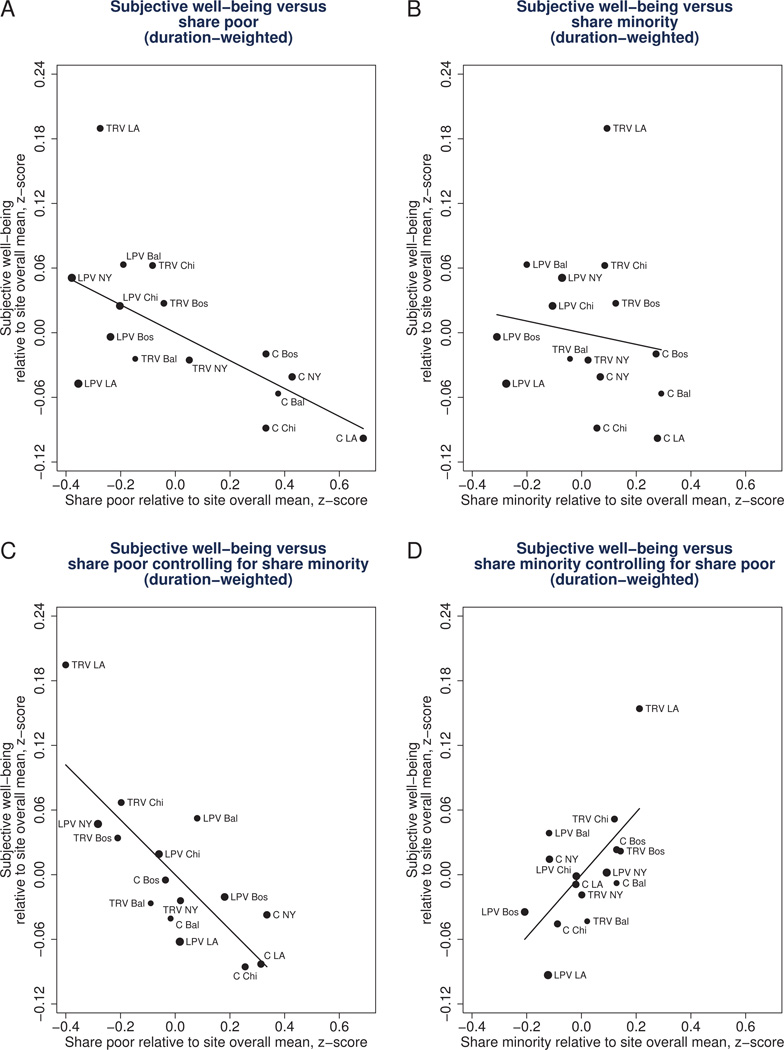
Fig. 2.
Instrumental variable estimation of the relationship between subjective well-being (SWB) and average (duration-weighted) tract poverty rate (panel A), tract share minority (panel B), tract poverty controlling for minority share (panel C), and tract minority share controlling for tract poverty (panel D). The y-axis is a 3-point happiness scale (1=not too happy, 2=pretty happy, 3=very happy) expressed in standard deviation units relative to the control group. Share poor is the fraction of census tract residents living below the poverty threshold. Share minority is the fraction of census tract residents who are members of racial or ethnic minority groups. Tract shares are linearly interpolated from the 1990 and 2000 decennial census and 2005–09 American Community Survey and are weighted by the time respondents lived at each of their addresses from random assignment through May 2008. Share poor and minority are z-scores, standardized by the control group mean and standard deviation. The points represent the site (Bal = Baltimore, Bos = Boston, Chi = Chicago, LA = Los Angeles, NY = New York City) and treatment group (LPV = low-poverty voucher, TRV = traditional voucher, C = control group). The slope of the line is equivalent to a 2SLS estimate of the relationship between subjective well-being and the mediator shown in each panel, using interactions of indicators for MTO treatment group assignment and demonstration site as instruments for the mediator (controlling for site indicator main effects).

