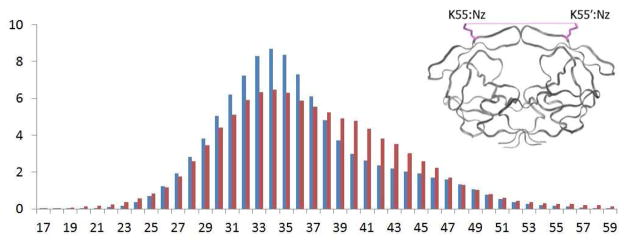
Figure 4.
Distribution in percent of distances in Å between the nitrogen atoms in the amino group of the K55 and K55′ side chain calculated over all 80 monomers during the 100 ns trajectories. Distribution data from the wild-type protease simulation are in blue, and from the Flap+ variant are in red.

