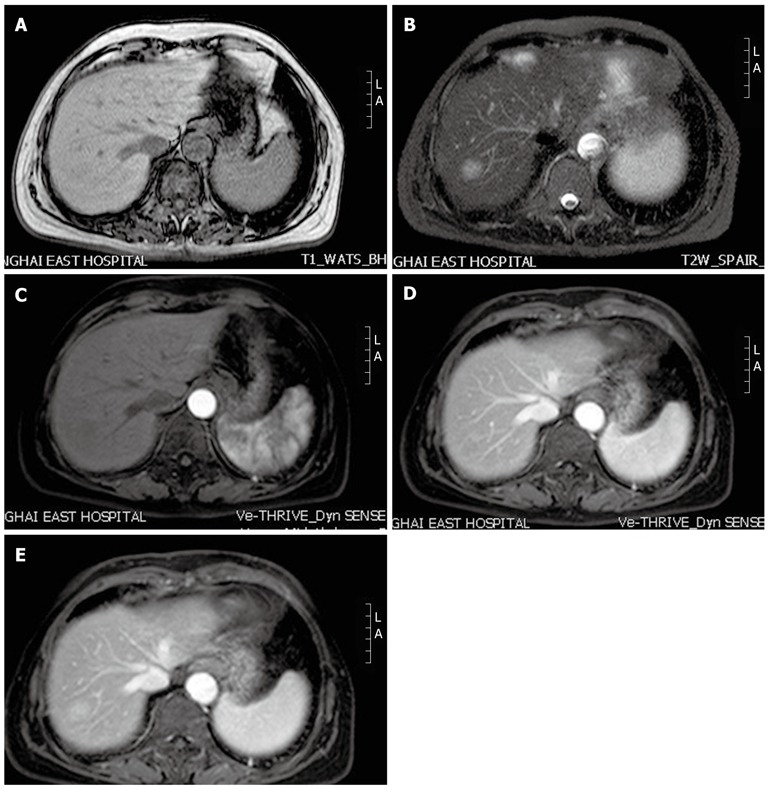
Figure 2.

Magnetic resonance imaging scan findings in our patient. A: On T1-weighted images, the hepatic lesion shows low signal intensity; B: On T2-weighted images, the lesion shows hyperintense signal intensity; C: In the arterial phase, the lesion remains unenhanced; D, E: During the portal and delayed phases, the lesion displays peripheral enhancement with a centripetal progression. L: Left; A: Ahead.
