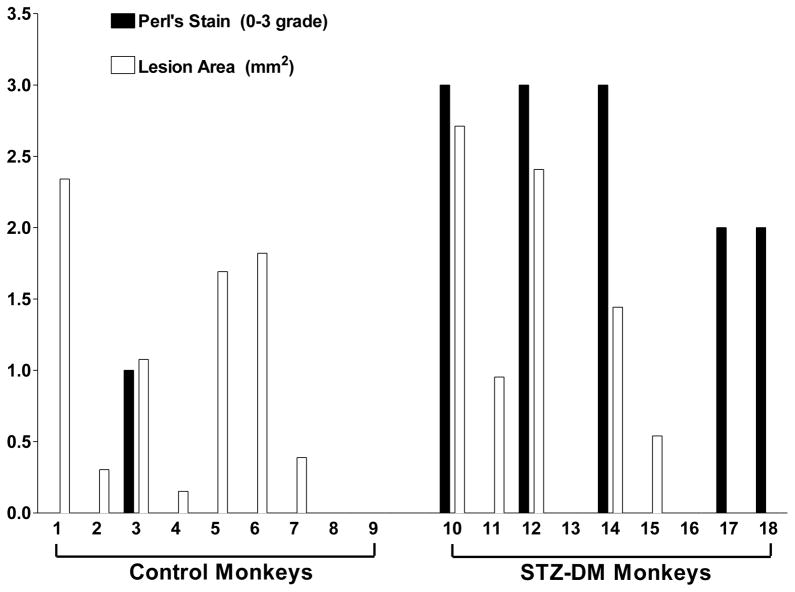
Figure 4. Atherosclerotic lesion area and iron staining in thoracic aortas from control and STZ-DM monkeys.
Cross sections of aorta tissue were fixed for immunohistochemistry and stained with Perl’s stain for ferric iron (Fe3+) as described in Methods. Morphometric analysis was used to determine atherosclerotic lesion area (white bars). Perl’s stain for Fe3+ (black bars) was quantified by assigning a grade of 0, 1, 2, or 3 based on presence or absence of blue staining as well as the number of stained regions within a section.

