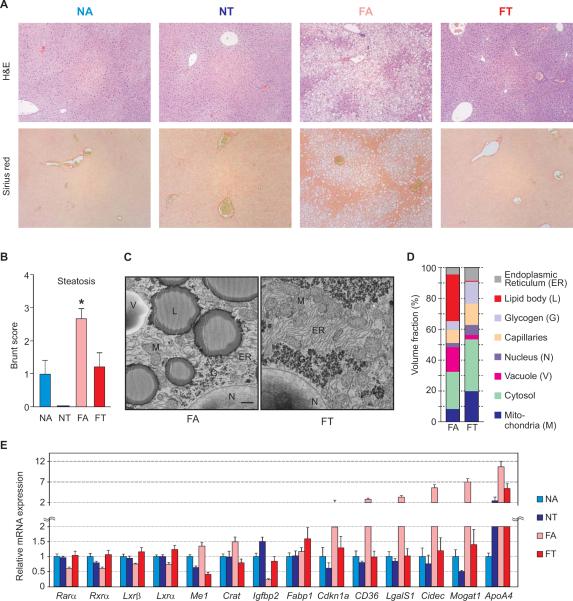
Figure 5. Time restricted feeding prevents liver diseases.
(A) Representative histopathology (upper panel, H&E, Scale bars 200 μm) and Sirius red (lower panel, Scale bars 200 μm) of the liver. Steatohepatitis was scored by a histopathologist who was blinded to the source condition of each sample using a semi-quantitative method derived from Brunt et al. (Brunt et al., 2004) measuring the degree of steatosis (0–3), ballooning degeneration (0–2), lobular (0–3) and portal (0–2) inflammation and fibrosis (0–4). (B) Average Steatosis score (+ SEM, n = 4 mice) of liver sections. (C) Representative scanning electron microscope image of a liver from FA mice shows large lipid droplets and vacuoles that are reduced in FT liver. Scale bar = 1 μm. (D) Measurement of several volume fractions show FT regimen prevents the decline in density of mitochondria and ER under ad lib HF diet (FA). Measurements are from volume rendering obtained from serial block-face images of the liver. See also Table S2. (E) Gene expression signature of diet-induced obesity in the mouse liver is attenuated by tRF. Average expression (+ SEM) from 8 different time points (Figure S2A) are shown in bar-graphs. Significant differences between FA and FT (*p < 0.05) were found. Temporal expression profiles of these genes are shown in Figure S5.

