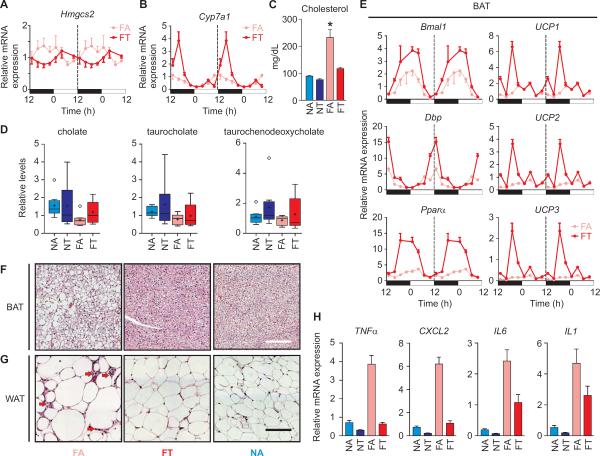
Figure 6. Time restricted feeding modulates bile acid metabolism, energy expenditure and inflammation.
tRF regimen (A) suppressed expression of Hmgcs2 and (B) increased expression of Cyp7a1 in the liver, which accompanied (C) a reduction in serum cholesterol and (D) increase in hepatic bile acids. Relative levels of representative bile acids are shown (also see Figure S6). (E) qRT-PCR measurements of relative mRNA levels of Bmal1, Dbp and Pparα show robust circadian oscillation in the BAT of FT mice (also see Figure S3 for NA and NT gene expression). Increased expression of UCP1-3 during the late night correlates with increased energy expenditure in FT mice (Figure 1). H&E stained sections of (F) BAT or (G) WAT show adipocyte hypertrophy in FA mice is prevented in the FT mice. Scale bar = 50 μm. Arrows indicate infiltrating cells that are most likely macrophages. Reduction in infiltrating macrophages also correlates with a reduction in (H) the mRNA levels of several pro-inflammatory cytokines in the WAT of FT mice. Average (+ SEM, n = 8, *p < 0.05) mRNA levels of pro-inflammatory cytokines TNFα, CXCL2, IL6 and IL1 in the WAT are reduced under tRF paradigm.

