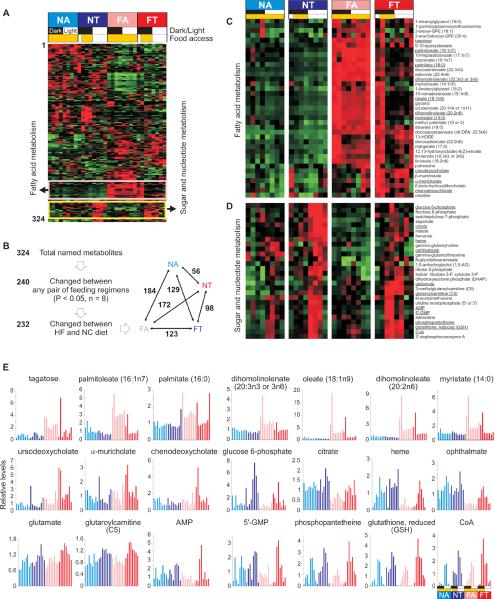
Figure 7. Time of feeding exerts a larger effect on liver metabolites in mice on a high fat diet.
(A) Heat-map rendering of normalized levels of 324 liver metabolites at eight different time points in the liver of NA, NT, FA and FT groups of mice. The metabolites were clustered by hierarchical clustering. (B) Summary of metabolite changes in the liver highlights the larger effect of temporal feeding pattern when animals were fed high fat diet. For statistical analyses, all eight time-points for each feeding regimen were treated as replicates. Number of metabolites that changed between any two of the six different contrasts is shown in the bottom panel. (C) Heatmap rendering of a subset of metabolites of a cluster enriched for fatty acids and (D) another cluster enriched in intermediates of energy- and anabolic- metabolism. Tissues were harvested at ZT14, 17, 20, 23, 2, 5, 8 and 11. The time of food access is indicated in yellow boxes. Red = high, Green = low. Steady state levels of several of the metabolites at 8 different time points representing one full day from (C) and (D) marked with underlined text are shown in (E). Normalized values presented in Table S1 are plotted against time.

