
Figure 2.
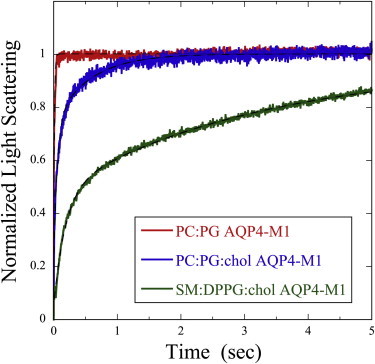
Osmotic gradient-driven changes in light scattering for proteoliposomes containing AQP4-M1 at similar molar protein/lipid ratios: POPC:POPG (P/L = 0.0023) (red trace), POPC:POPG:cholesterol (P/L = 0.0018) (blue trace), and SM:DPPG:cholesterol (P/L = 0.0015) (green trace). The traces were normalized as in Fig. 1 and fits are shown (black dotted lines). Although data were recorded for a 10-s time interval for proteoliposomes containing SM:DPPG:cholesterol, the light-scattering data are displayed for only the first 5 s to better show the differences among the three lipid systems. From these traces, the values of k were determined to be 120.5 s−1 for POPC:POPG proteoliposomes and 47.3 s−1 for POPC:POPG:cholesterol proteoliposomes. For the SM:DPPG:cholesterol proteoliposomes, the two values of k were 5.0 s−1 and 0.2 s−1.