
Figure 3.
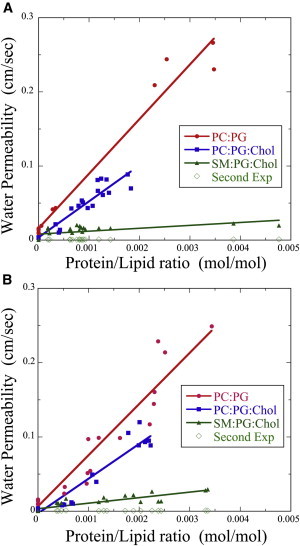
Plots of pf as a function of protein/lipid ratio (M/M) for AQP4-M1 (A) and AQP4-M23 (B) in bilayers composed of POPC:POPG (8:2) (red circles), POPC:POPG:cholesterol (4:2:4) (blue squares), and SM:DPPG:cholesterol (4:2:4) (green triangles and green diamonds). For proteoliposomes made with POPC:POPG or POPC:POPG:cholesterol, each osmotic gradient run yielded a single value of k, and therefore a single value of pf that increased with increasing P/L ratio. For each SM:DPPG:cholesterol proteosome, the osmotic gradient yielded two values of k: one gave pf that increased with increasing P/L (green triangles), whereas the other gave pf that stayed nearly constant as a function of P/L (green diamonds) and had similar magnitudes to SM:DPPG:cholesterol liposomes (P/L = 0).