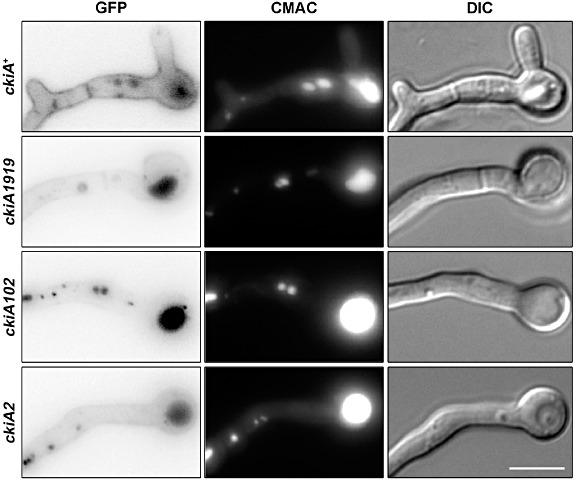
Fig 7.

Localization of AgtA–GFP in ckiA mutants. Epifluorescence images of AgtA–GFP in strains carrying each of the three ckiA alleles (left panel). CMAC and differential interference contrast microscopy (DIC) images are shown on the middle and right panels respectively. Strains AMC132, CAM51, AMC314 and AMC129 were grown in MM containing GABA as nitrogen source for 16 h at 25°C. Scale Bar (5 µm) shown to the right of the DIC panel.
