
Figure 2. Values from X-ray diffraction.
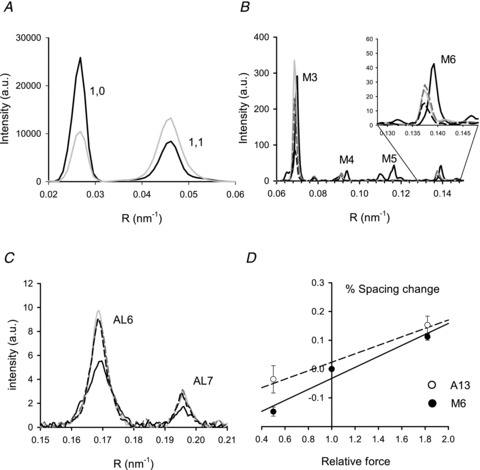
A, intensity profiles of the equatorial reflections 1,0 and 1,1 at rest (black line) and at T0 (grey line). B, intensity profiles of the myosin meridional reflections from M3 to M6. Black and grey lines as in A; grey dashed line during shortening and black dashed line during lengthening. The inset shows the region around the M6 on an expanded scale. C, intensity profiles of the 6th and 7th actin layer lines. Line code as in B. D, percentage change in spacing of M6 (•) and A13 (○, calculated as explained in the text) versus force. The slopes of the linear regression fits to M6 data (continuous line) and to A13 data (dashed line) estimate myosin and actin filament compliance, as described in the text and Table 1. Total exposure times: 50 ms rest, 25 ms tetanus.