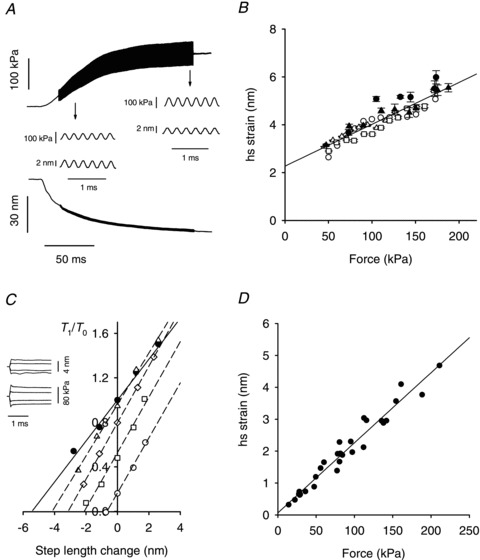
Figure 4. Strain and compliance during the tetanus rise and at different forces in rigor.

A, force and half-sarcomere length traces showing the superimposed 4 kHz oscillations during the isometric force development. The insets: force and hs length oscillations on an expanded time scale at the times indicated by the arrows. Fibre length, 5.25 mm; CSA, 0.023 mm2; segment length, 1.29 mm. B, relation between half-sarcomere strain (Shs) and force (T) during tetanus rise, from length steps (filled symbols) or 4 kHz oscillations (open symbols). Pooled data from six experiments (different symbols). The median of 5 observations per step group and 47 per oscillation group. Line: linear regression of pooled data, Shs=Cf×T+Sx, where Cf, the filament compliance = 17.5 ± 1.1 nm MPa−1 and Sx, the myosin head strain = 2.27 ± 0.13 nm. C, T1 relations in active contraction (•, from open circles in Fig. 3C) and in rigor (open symbols) at four different steady forces (▵, 0.95 T0; ◊, 0.8 T0; □, 0.5 T0; ○ 0.2 T0). The slopes (hs stiffness, T0 nm−1) of the linear regressions are 0.184 ± 0.009 (•), 0.231 ± 0.007 (▵), 0.254 ± 0.003 (◊), 0.249 ± 0.009 (□), 0.247 ± 0.001 (○). D, half-sarcomere strain versus steady force from three fibres in rigor. Force has been normalised by the CSA in the relaxed fibres.
