
Figure 6. Relationship between quick force recovery and step size.
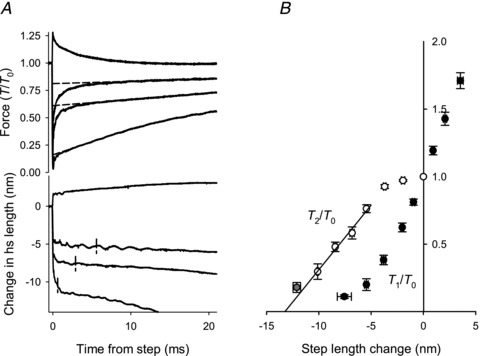
A, example records of force (upper panel) and of hs length change (lower panel) during and after step length changes. The force attained in the quick recovery (T2) was measured by back-extrapolating the later phase of force recovery to the time of the step, as shown by the broken lines. The value of T2/T0 is the ordinate intercept of the broken lines. Vertical lines in the lower panel mark hs length change and the time at which force had recovered to T2/T0. B, T1/T0 (•) and T2/T0 (○) versus hs length change. Data from four experiments, grouped in classes of hs length changes of 1.5 nm hs−1 except the grey circle for which the range is 10.5–14 nm hs−1. The bars show the SEM values in both X and Y directions where these are larger than the size of the symbols. The full line is the regression line through T2/T0 points for steps larger than 5 nm. Abscissa intercept =−13.8 ± 0.4 nm.