
Figure 2.
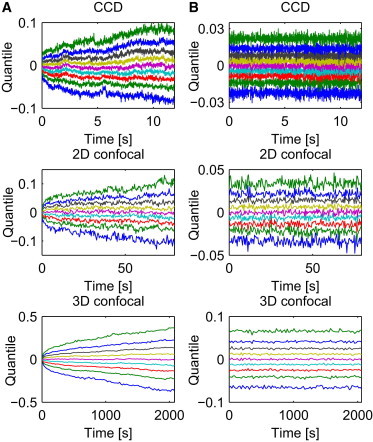
Quantile lines of X trajectories (A) and of their increments (B) corresponding to each of the time regimes: CCD (top panel), 2D confocal (middle panel), 3D confocal (bottom panel). The shape of the quantile lines shows the self-similar (A) and stationary (B) behaviors.