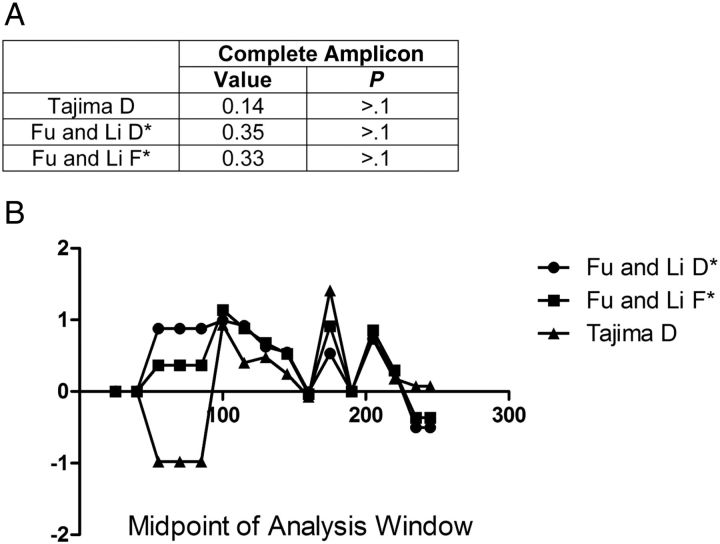
Figure 4.
Tests of neutrality to evaluate for selection on csp. A, Results for Tajima D and Fu and Li D* and F* statistics on the complete sequences of csp. B, Results of the same tests as in A, using a sliding window of 50–base pair size over the complete amplicon (slide of 15 base pairs). The y-axis is the statistical result for the index. The x-axis represents the midpoint base pair of the window evaluated. Despite peaks in the Tajima's D around TH2 and TH3, no significant evidence of selection is seen across this region (no value of the index >2). Fu and Li D* and F* tests also showed a positive trend in these regions. The positive nature of these indexes suggests an excess of intermediate-frequency alleles in a population and can result from either balancing selection or population bottlenecks.

