
Figure 4.
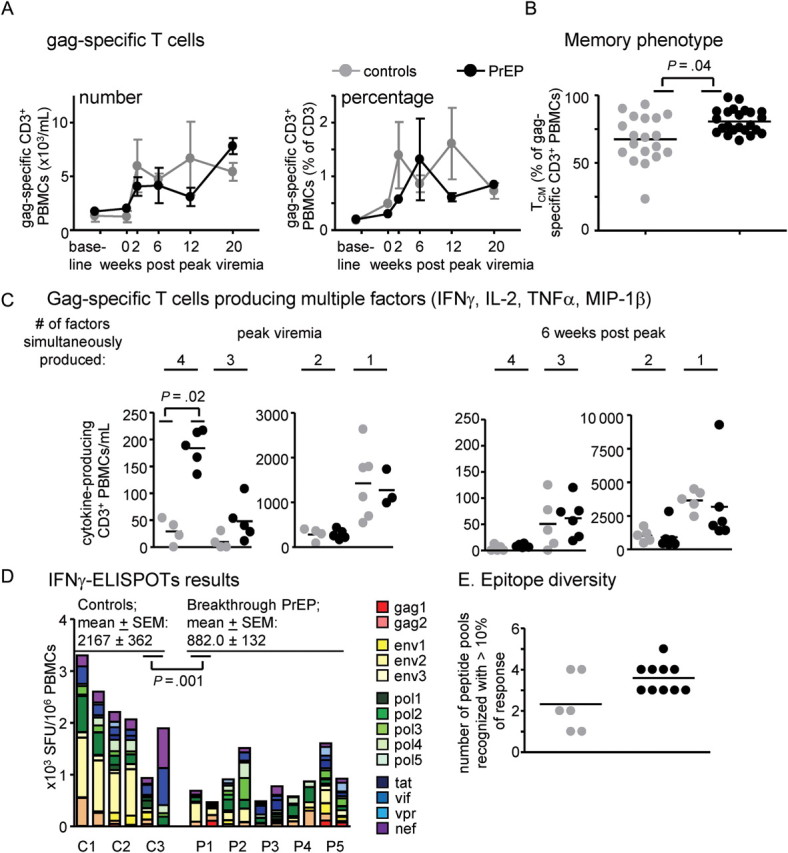
Enumeration and characterization of SHIV-specific T cells (gag-specific [A–C], or specific for gag, env, pol, tat, vif, vpr, and nef products [D and E]). A. Induction of gag-specific T cells. We identified gag-specific T cells by flow cytometry, after in-vitro incubation of freeze-thawed cells with gag1/gag2 peptide pools, then enumeration of CD3+ cells with intracellular production of IFNγ, IL-2, MIP-1β, and/or TNFα. The left panel shows numbers, the right panel shows percentages of gag-specific PBMCs. B. gag-specific T cells were further analyzed for central memory TCM (shown) or effector memory TEM (not shown) phenotype. TCM cells were defined as CD3+ CD69+ (IFNγ, TNFα, MIP-1β, and/or IL-2)+, CD28high, CCR7+. The asterisk indicates statistical significance (P = .04, generalized estimation equations method) between control and PrEP-infected groups when analyzing T cells from peak, and 6, 12, and 20 weeks thereafter, combined. (C). Gag-specific cells were divided by their ability to produce cytokines/ chemokines IFNγ, TNFα, MIP-1β, and/or IL-2 (referred to as “factors”) alone, or to produce them simultaneously in any combination. The P value was obtained by Wilcoxon rank-sum test. Differences in cells producing one to three factors at peak viremia, or differences in cells producing any number of factors after peak viremia, were not statistically significant. D, E. SHIV-specific, IFNγ+ cells in fresh blood samples were analyzed by IFNγ-ELISPOT. We analyzed blood collected on two independent occasions between weeks 10 and 12 post peak viremia from 3 control macaques (C1–C3), and 5 PrEP-breakthrough macaques (P1–P5). Responses to 14 peptide pools derived from the indicated gene products were combined to calculate the indicated spot forming units (SFUs; D). Mean values and standard error of the mean (SEM) are given; the P value was calculated with the generalized estimation equations method. E. The graph displays the number of peptide pools recognized with ≥10% of the response; differences between the groups were not statistically significant.