Figure 1.
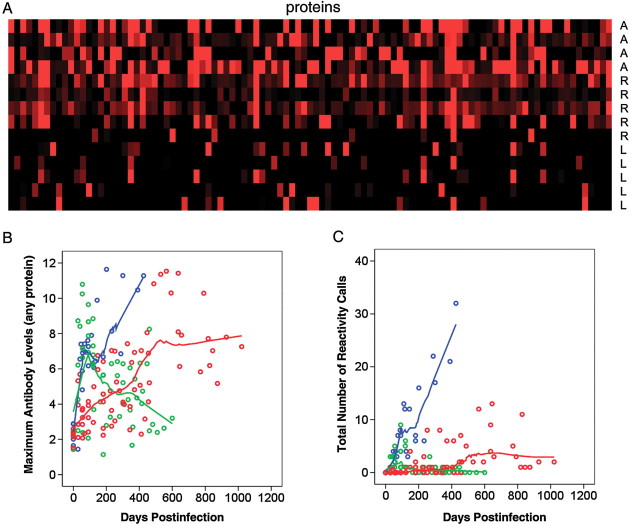
Antibody responses in cynomolgus macaques. Fourteen cynomolgus macaques were infected intratracheally with approximately 25 colony-forming units of Mycobacterium tuberculosis strain Erdman per animal. Preinfection sera and approximately 10 postinfection sera per animal were tested with proteome microarrays. The number of sera per macaque varied depending on the duration of follow-up, which was shortest for the animals in the active class. Based on Z statistics, 101 proteins were identified as significantly reactive to postinfection sera, compared with pre-infection sera. A, Maximal antibody levels obtained at any time point to the 101 reactive proteins (columns) are shown. The data were normalized to preinfection sera signal intensities by Z score estimation; the red color indicates Z score = 2, and the black color indicates Z score = 0. A, active class; L, latent class; R, reactivation class. B, Maximal antibody levels over time. Each circle represents maximal antibody level to any of the 101 reactive proteins in a particular macaque. Outcome groups are color-coded: blue, active; green, latent; red, reactivation. Locally estimated scatterpoint smoothing (LOESS) regression curves are shown. C, Numbers of reactive proteins over time. Each circle represents the total number of reactive proteins in a particular macaque. As in B, outcome groups are color-coded, and LOESS regression curves are shown.

