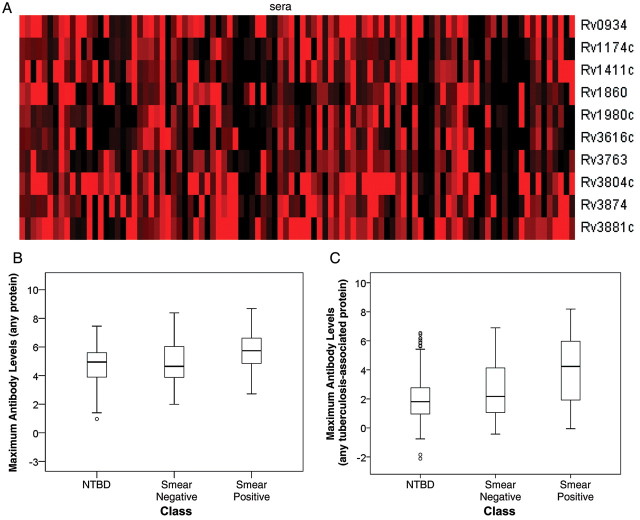
Figure 2.
Antibody levels in tuberculosis suspects. The Mycobacterium tuberculosis proteome arrays were probed with sera from 169 active tuberculosis and 228 nontuberculosis disease (NTBD) patients. Reactive proteins (n = 356) were identified by Z statistics, and proteins associated with active tuberculosis (n = 10) were identified by odds ratio calculation. A, Heat map of reactivity (Z scores) to 10 tuberculosis-associated proteins (rows) is shown for reactive sera from tuberculosis patients (columns); the red color indicates Z score = 3 and the black color indicates Z score = 0. B, Distribution of maximal antibody levels to any of the 356 reactive proteins by diagnostic class. The box plots show the median of the distribution (horizontal line in the box), the interquartile range (box), the range excluding outliers (whiskers), and the outliers (circles). C, Distribution of maximal antibody levels to any of the 10 tuberculosis-associated proteins by diagnostic class. Data are presented as box plots, as in B.

