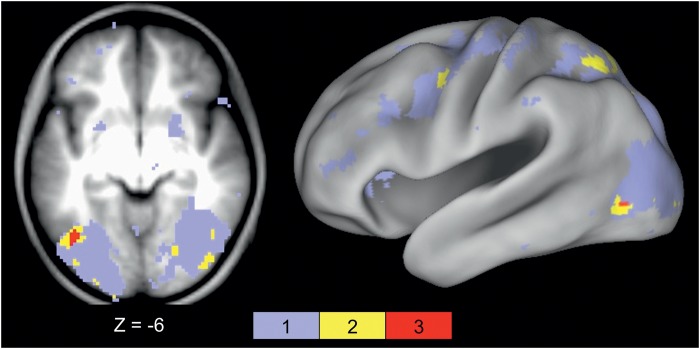
Figure 10.
A single left OT region shows all previously described interactions. Location of the OT region (−41, −66, −4, MNI) showing all 3 (stimulus type by timecourse, complexity by timecourse, and pair type by timecourse) interactions. Voxels showing a significant interaction in all 3 ANOVAs are shown in red in both a transverse slice through fusiform cortex (left panel) and projected to the surface of a semi-inflated CARET surface (right panel). This region also had a significant pair type by stimulus type by timecourse interaction.

