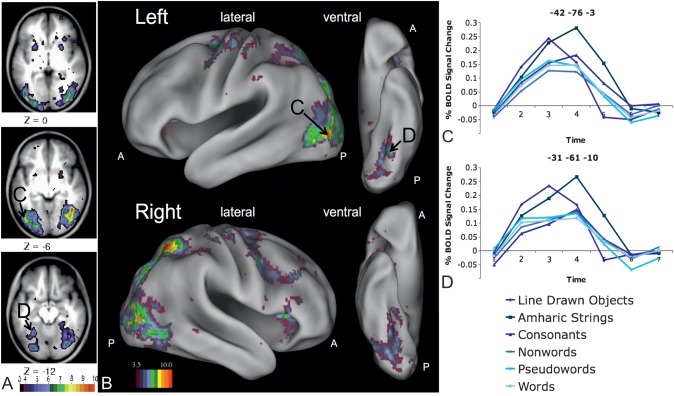
Figure 2.
Left fusiform regions showing a stimulus type by timecourse interaction. (A) Image derived from the whole-brain analysis, focusing on slices in occipital and fusiform cortex, showing voxels with a significant stimulus type by timecourse interaction. (B) Whole-brain analysis image showing all voxels with a significant stimulus type by timecourse interaction projected to the surface of semi-inflated brain surfaces rendered with CARET (Van Essen et al. 2001; http://brainmap.wustl.edu/caret). Letter labels indicate regions for which timecourses are shown in panels (C) and (D). (C) Timecourses for all 6 stimulus types in a left fusiform region posterior and superior to the classically described VWFA (−42, −76, −3 in MNI coordinates). Further ANOVAs show this interaction is due to more activity for Amharic characters than pictures (P < 0.001) and letter strings (P < 0.001 for all) and more activity for pictures than letter strings (P < 0.001 for all). (D) Timecourses for all 6 stimulus types in a left fusiform region anterior and medial to the classically described VWFA (−31, −61, −10 in MNI coordinates). Further ANOVAs show this interaction is due to more activity for Amharic characters than pictures (P < 0.001) and letter strings (P < 0.001 for all) and more activity for pictures than letter strings (P < 0.001 for all).

