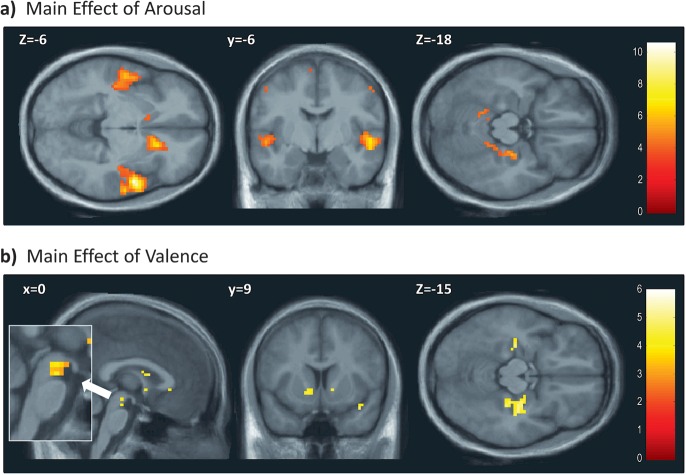
Figure 6.
Regression analysis for arousal (a) and valence (b) separately. Results of second-level one-sample t-tests on activation maps obtained from a regression analysis using the explicit emotion ratings of arousal and valence separately. Main figures: P ≤ 0.001, uncorrected, inset: P ≤ 0.005, uncorrected.

