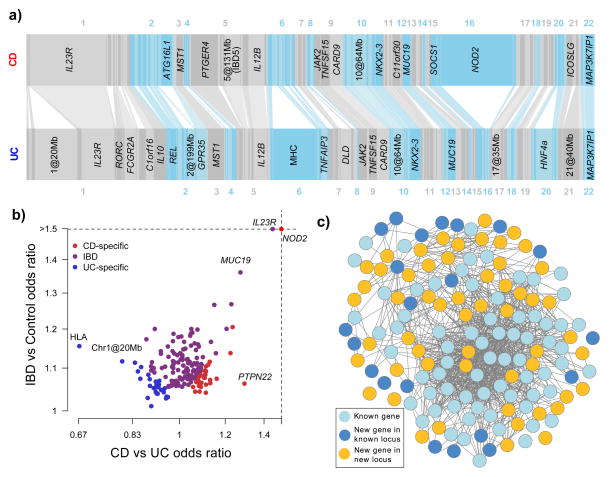
Figure 1. The IBD genome.
A) Variance explained by the 163 IBD loci. Each bar, ordered by genomic position, represents an independent locus. The width of the bar is proportional to the variance explained by that locus in CD and UC. Bars are connected together if they are identified as being associated with both CD and UC. Loci are labeled if they explain more than 1% of the total variance explained by all loci for that phenotype. B) The 193 independent signals, plotted by total IBD odds ratio and phenotype specificity (measured by the odds ratio of CD relative to UC), and colored by their IBD phenotype classification from Table 1. Note that many loci (e.g. IL23R) show very different effects in CD and UC despite being strongly associated to both. C) GRAIL network for all genes with GRAIL p < 0.05. Genes included in our previous GRAIL networks in CD and UC are shown in light blue, newly connected genes in previously identified loci in dark blue, and genes from newly associated loci in gold. The gold genes reinforce the previous network (light blue) and expand it to include dark blue genes.

