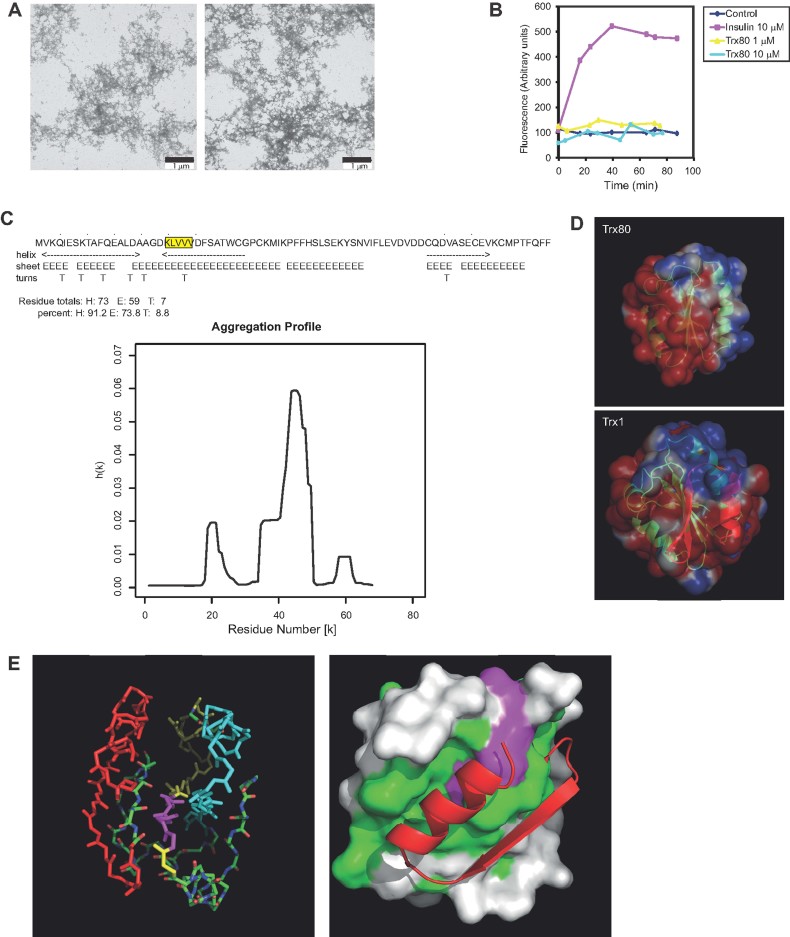
Figure 2. Aggregation of Trx80.
- Electron micrographs of recombinant Trx80 (10 µM) samples incubated O/N at 37°C in PBS (left) or heated to 95° prior to O/N incubation at 37°C (right). Formation of a diffuse network of aggregates was detected without structures resembling mature fibrils.
- This was confirmed by ThT assay. Insulin served as a positive control.
- Chou-Fasman plot and predicted aggregation profile of Trx80 revealed two major pro-aggregation areas, Trx80(20–37) and (47–60).
- Calculated surface of Trx80 using the X-ray diffraction-determined crystal structure for Trx1(1ERT). Red and blue areas show negative and positive potential, respectively.
- Trx1 backbone structure (using 1ERT coordinates) showing the key regions of the structure (left panel): in red, the differential segment with Trx80 and in yellow and cyan, the two possible aggregation zones from D. In the left panel, residues 21–25 (KLVVV) are shown in magenta. Trx80 calculated surface (right panel) showing the exposed hydrophobic patch (green) and residues 21–25 (magenta).

