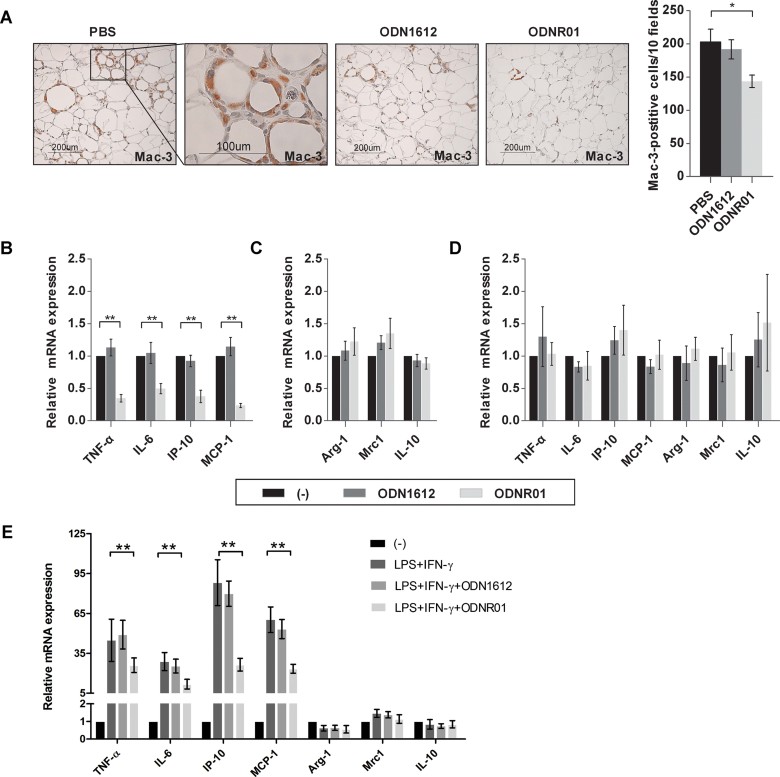
Figure 5. Macrophage accumulation and M1 inflammatory factor expression in VAT from DIO mice treated with or without different ODNs or in vitro cultured macrophages.
- A. Immunostaining of VAT with rat anti-mouse Mac-3 mAb. Graph represents the number of Mac-3+ cells in each 10 fields.
- B-E. RT-PCR determined mRNA levels of (B) M1 markers (TNF-α, IL-6, IP-10 and MCP-1) and (C) M2 markers (Arg1, Mrc1 and IL-10) in VAT after normalizing to GAPDH. Fold change was calculated relative to PBS group. RT-PCR determined mRNA levels (normalized to GAPDH) of M1 markers (TNF-α, IL-6, IP-10 and MCP-1) and M2 markers (Arg1, Mrc1 and IL-10) in untreated BMDMs (D) or BMDMs that were stimulated with LPS (10 ng/ml) and IFN-γ (100 U/ml) for 24 h (E), with or without 5 µM ODNR01 or ODN1612. Fold change was calculated relative to medium group (−). Data represent three independent experiments. *p < 0.05; **p < 0.01, n = 4∼6.

