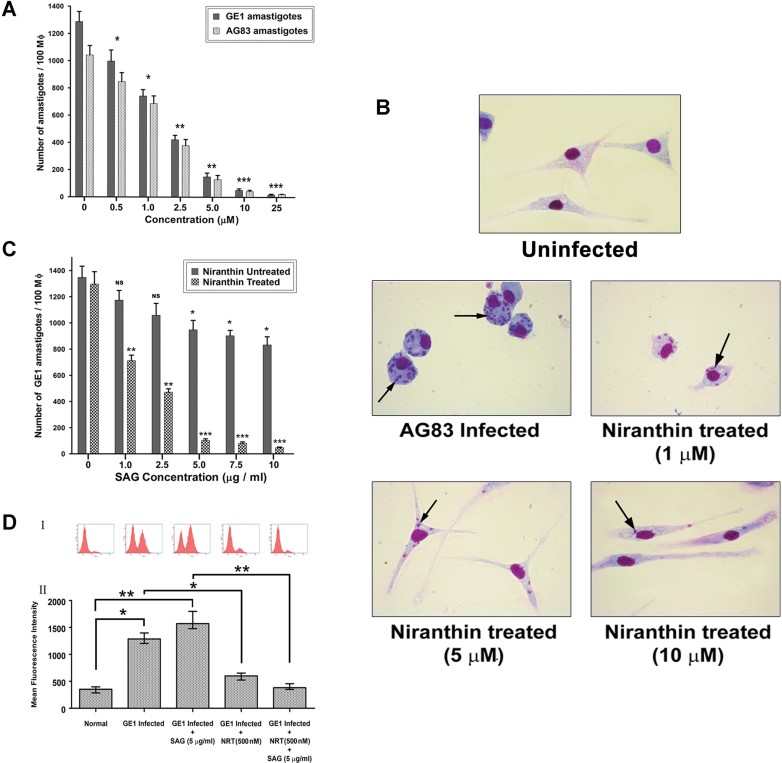
Figure 5. Clearance of SbS L. donovani (AG83) and SbR L. donovani (GE1) parasites from infected mouse macrophages by reversal of multidrug resistance.
- Dose dependent clearance of AG83 amastigotes (
 ) and GE1 amastigotes (
 ) by niranthin from infected macrophages. The number of internalized amastigotes within each infected macrophages were counted under bright field microscope. The results shown are the means of three independent experiments and plotted as mean ± SD. *p < 0.05, **p < 0.01, ***<0.001 (Student's t-test) indicate statistical significance between infection control and respective niranthin treatment.
 - Images of Giemsa-stained intracellular parasites in cultured murine macrophages treated with 1, 5 and 10 µM of niranthin compared to an infection control and uninfected control. Arrows indicate the internalized parasites.
- Comparative analysis of effectiveness of niranthin as combination therapy with SAG on GE1 amastigotes. The results shown are the means of three independent experiments with Standard Deviation. *p < 0.05, **p < 0.01, ***<0.001 (Student's t-test). NS denotes there is no significant difference between GE1-infected macrophages and corresponding SAG treatment.
- Flow cytometric analysis of levels of expression of P-gp in murine peritoneal Mϕ following in vitro infection with SbR L. donovani (GE1) and after treatment with niranthin and SAG. Panel I shows the histogram of mean fluorescence intensity. Mean fluorescence intensity was plotted for each sample representing of three independent experiments with Standard Error (panel II). *p < 0.05 (Student's t-test). **Indicates significant difference between control macrophages and infection groups or co-treatment groups (p < 0.01).

