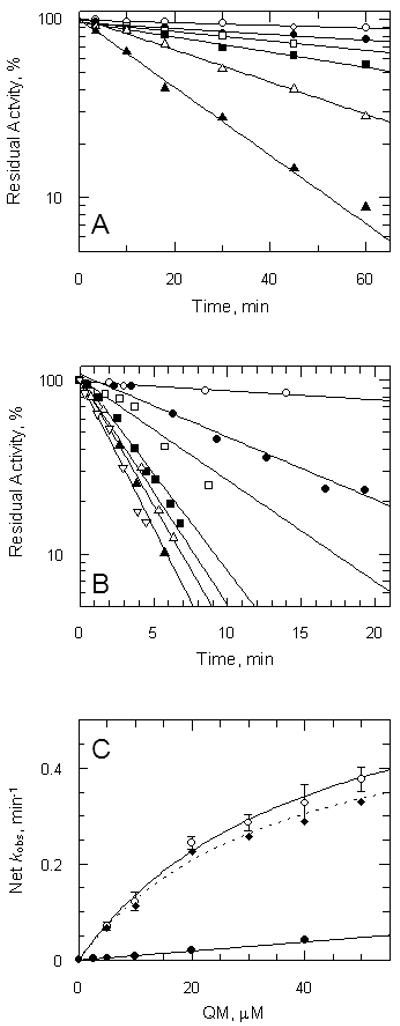
Figure 5. Kinetics of inactivation of trypanothione reductase by quinacrine mustard.

Panel A, oxidised enzyme. TryR (1 μM) was incubated at room temperature with addition of QM at time zero. Aliquots were removed at intervals and residual activity determined by 100-fold dilution into assay buffer containing 150 μM NADPH as described in the Experimental Procedures. Residual activity is expressed as a percentage of the activity at zero time without addition of QM. Lines are the non-linear fits for a single exponential decay. Concentrations of QM were: zero, ○; 2.5: ●; 5 □; 10: ■: 20:  ; and 40 μM: ▲. Panel B, reduced enzyme. TryR (1 μM) was preincubated with 150 μM NADPH for 5 min prior to addition of QM. Concentrations of QM were: zero, ○; 5, ●; 10, □; 20, ■, 30,
  ; 40, ▲; and 50 μM,
  . Assays were performed and analyzed as described above. Panel C, rate of inactivation of TryR as a function of QM concentration. Pseudo-first-order rates of inactivation (kobs) were obtained from data in panels A and B and corrected for inactivation in the absence of inhibitor (Net kobs). Error bars are standard errors of the mean determined by non-linear regression. Data for oxidised enzyme (●) are fitted by linear regression; data for NADPH-reduced TryR (○) are fitted to equation 2 (see text). The diamond symbols represent the net rate for the reduced enzyme corrected for the linear rate observed for the oxidised enzyme.
