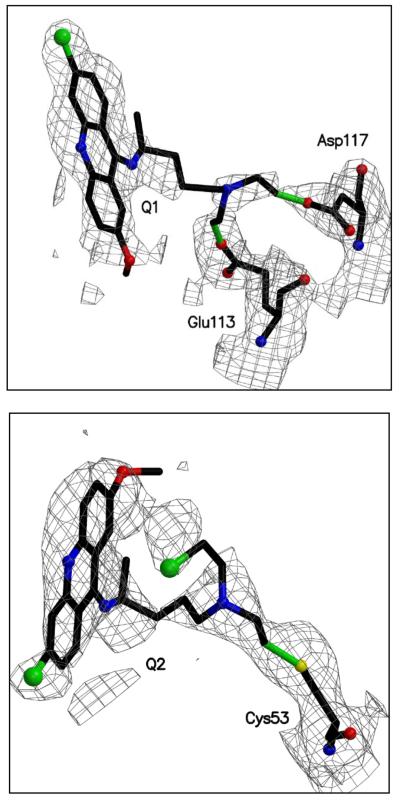
Figure 7. The difference density maps of both inhibitor molecules binding to subunit A.
All atoms shown were omitted from the structure factor calculation. The density is contoured at the 1σ level of that observed in the unit cell and is depicted in chicken wire, green bonds indicate the covalent attachment between the inhibitor and the protein.

