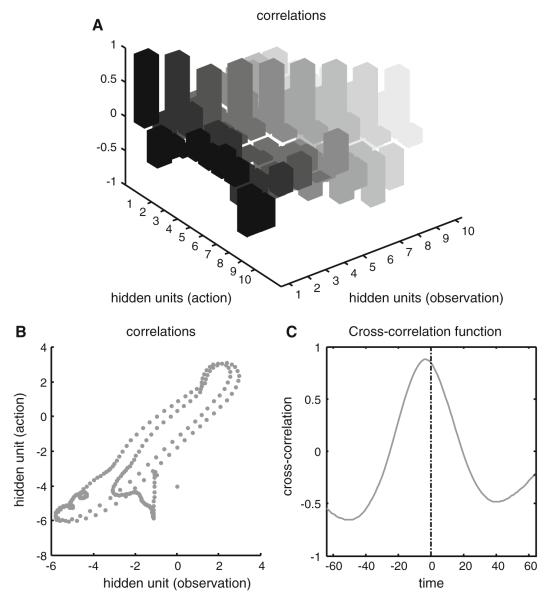
Fig. 7.
This figure illustrates the correlations between representations of hidden states under action and observation. a The cross-correlation (at zero lag) between all ten hidden state-units. The first four correspond to the positions and velocities of the joint angles, while the subsequent six encode the attractor dynamics that represent movement trajectories during writing. The key thing to note here is that the leading diagonal of correlations is nearly one, while the off-diagonal terms are distributed about zero. This means that the stimulus (visual) input-dependent responses of these units are highly correlated under action and observation; and would be inferred, by an experimenter, to be representing the same thing. To provide a simpler illustration of these correlations, b plots the response of a single hidden state unit (the same depicted in the previous figure) under observation and action, respectively. The cross-correlation function is shown in c. Interestingly, there is a slight phase shift suggesting that under action the activity of this unit occurs slightly later (about 4-8ms)

