
Fig. 2.
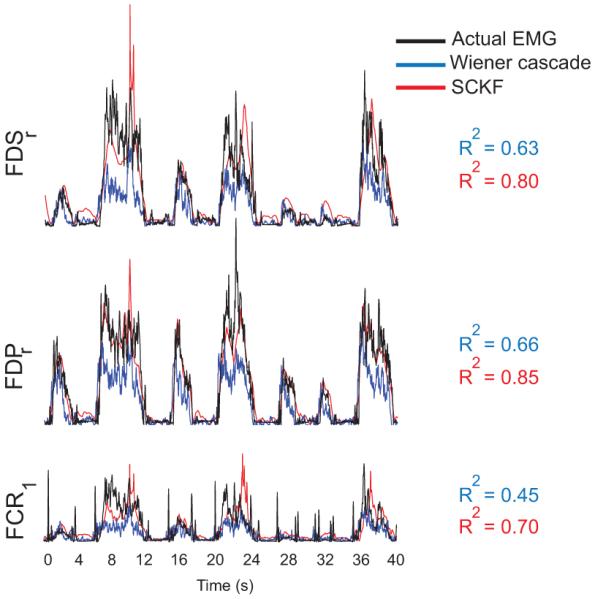
An example of actual (black) and predicted EMG signals using the Wiener cascade filter (blue) and the simplified constrained Kalamn filter (SCKF, red) during the ball-grip task. The R2 values were calculated from a 40 second segment of data in this example.