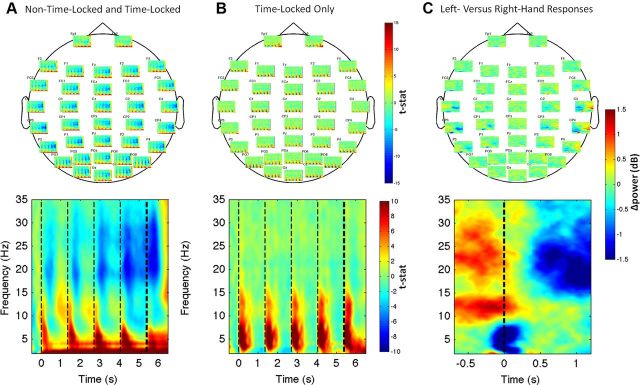
Figure 2.
Overall and evoked time–frequency effects during decision making and after responses. A, B, In the overall response (A) but not the time-locked response (B), alpha (8–14 Hz) and beta (15–25 Hz) modulation followed presentation of cue stimuli and progressively desynchronized over the trial. Top, Average effects at individual sensors. Bottom, Effects averaged across sensors. C, Topography of the beta rebound lateralization is evident in the average time–frequency map for the subtraction of left- and right-handed responses. The bottom panel shows the further subtraction between the left-hemisphere ROI (C3, CP3) and right-hemisphere ROI (C4, CP4). Light vertical dashed lines, Onset times of cue stimuli; heavy dashed lines, onset of the go cue in A and B and the response time in C.

