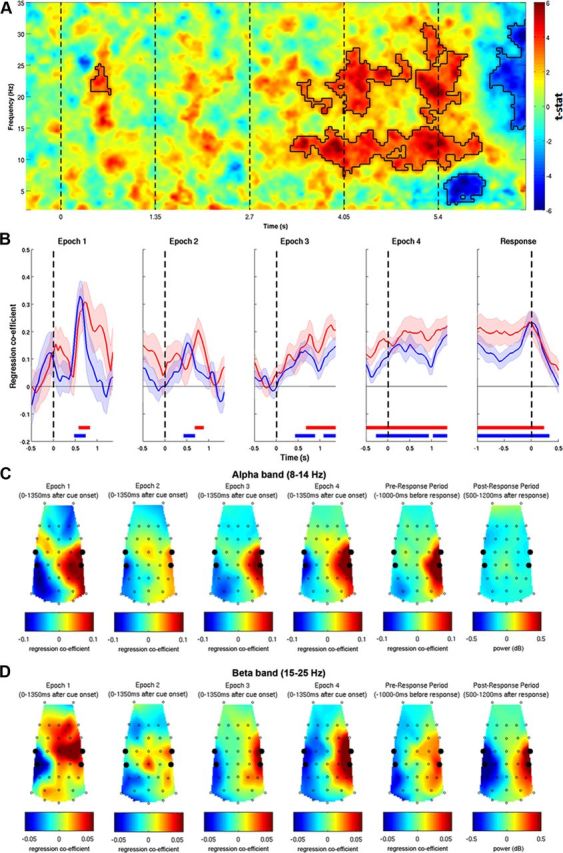
Figure 3.

Spectral correlates of integrated decision evidence. A, Lateralization of spectral activity correlating with the integrated WOE at the end of four-cue trials evolved throughout the trial. Solid black lines encircle significant effects. B, Regression coefficient between the integrated overall WOE in each epoch of the trial and alpha (thin red line) and beta (thin blue line) lateralization. Error bars indicate SEM. Thick horizontal lines indicate significant effects. Dashed lines indicate onset times of cues and the go signal. C, D, Both frequency bands correlated with the WOE at consistent central and parietal scalp locations (left 5 plots in each row). As positive WOEs favored left responses, the WOE correlated positively with left-hemisphere oscillatory activity and negatively with right-hemisphere oscillatory activity. A post-response beta-band rebound was found at the same electrode locations (bottom right). All topographies depict a birds-eye view of the scalp, with anterior locations at the top. Large black dots highlight electrodes contributing to regions of interest.
