
Figure 4.
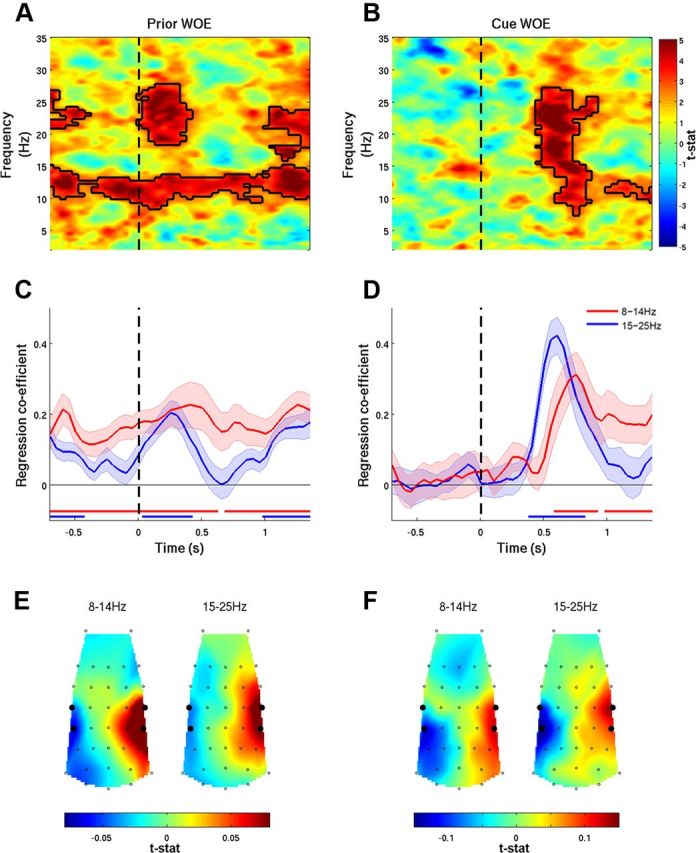
Temporal dynamics of oscillatory lateralization within epochs. A, B, Correlates of the prior WOE were sustained over trial epochs (A), whereas correlates of cue update WOE were only observed after the cue had been processed (B). Solid black lines encircle significant effects. C, D, Time course of average alpha and beta activity reflecting the prior WOE and update WOE. Horizontal red/blue lines indicate significant effects. E, F, Topographies of the regression coefficients averaged across the entire epoch for the prior WOE regressor and from 400 ms after cue onset until the end of the epoch for the update WOE regressor. Large black dots highlight electrodes contributing to regions of interest.