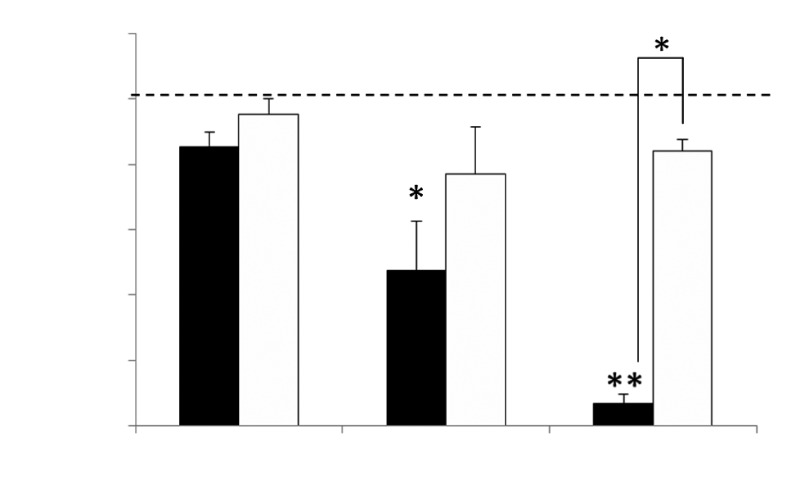
Fig. 1.
Study of survival of HCT116(p53+/+) cells after NTP (black columns) and non-ionised argon (white columns) treatment as a function of exposure time. The percentage of living cells against the intact control (dashed line) is shown. Mean values ± SD are given. * – p < 0.05, ** – p < 0.005 (as compared to the intact cells).

