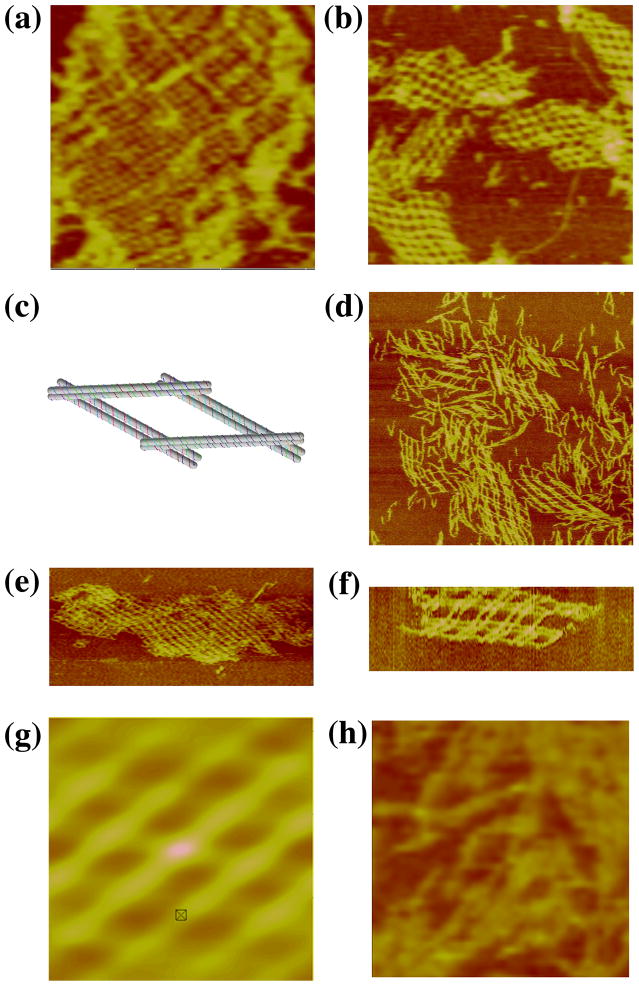
Figure 2. Experiments with Parallelogram Arrays. (a) A ( 4+4) × (4+4) Single Cohesion Parallelogram Array.
The dimensions of the image are 310 × 310 nm. The pseudo periodicity is 13 nm (both inside and outside the parallelogram are the same size) in agreement with expected values. The angle between directions is 68°, established from the autocorrelation function (not shown). (b) A ( 6+2) × (6+2) Single Cohesion Parallelogram Array. The dimensions of the image are 1500 × 1500 nm. The repeat distance is 27 nm and the angle found is 60. (c) Schematic of the PDX-E-O Motif. The relationship of the four different DX molecules and their constituent strands is visible. (d) An Array Formed by the PDX-E-E Motif. The image dimensions are 800 × 800 nm. The periodicity is 40 nm. (e) An Array Formed by the PDX-E-O motif. The image dimensions are 1500 × 750 nm. (f) A Zoom of the Array shown in (e). This image has been rotated 90 from the view in (e). The dimensions are 200 × 100 nm. (g) The Autocorrelation Function of the Image in (f). The dimensions are 150 × 150 nm. The periodicity is 40 nm and the angle between directions is 50. (h) A Control Experiment with Single Cohesion. This is the same self-assembly as in panels (e–g), but with only a single sticky end in each direction. The dimensions of this image are 200 × 200 nm. Other than a single box-like image slightly left of center, there is nothing reminiscent of the arrays seen in the successful self-assemblies.

