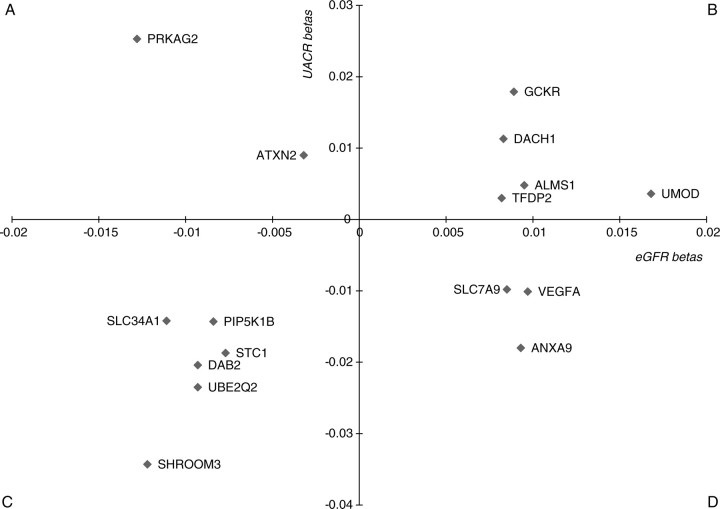
Figure 1.
Scatter plot of SNP effects on the eGFR and the UACR. Quadrants labeled (A) (lower eGFR effect size, higher UACR effect size) and (D) (higher eGFR effect size, lower UACR effect size) represent associations consistent with the observed correlation of the eGFR and the UACR; quadrants labeled (B) (higher eGFR effect size, higher UACR effect size) and (C) (lower eGFR effect size, lower UACR effect size) represent associations inconsistent with the observed correlation of the traits.

