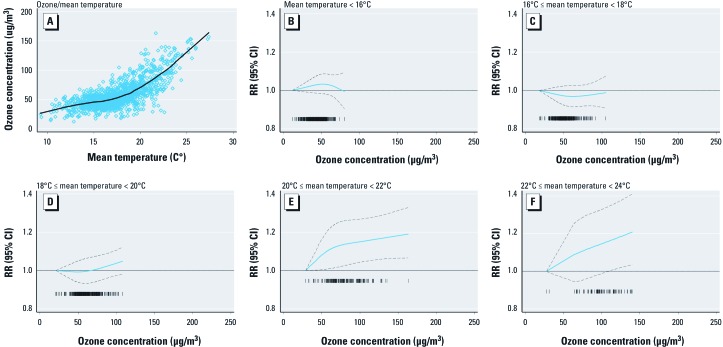
Figure 2.
Sensitivity analyses of the ozone–mortality relationship for London during the summer months. (A) Scatter plot of ozone concentrations versus mean temperature for study days, 1993–2006. (B–F) Relative risk of death and 95% CIs associated with ozone concentration for mean temperatures (B) < 16°C, (C) ≥ 16°C but < 18°C, (D) ≥ 18°C but < 20°C, (E) ≥ 20°C but < 22°C, (F) ≥ 22°C but < 24°C.

