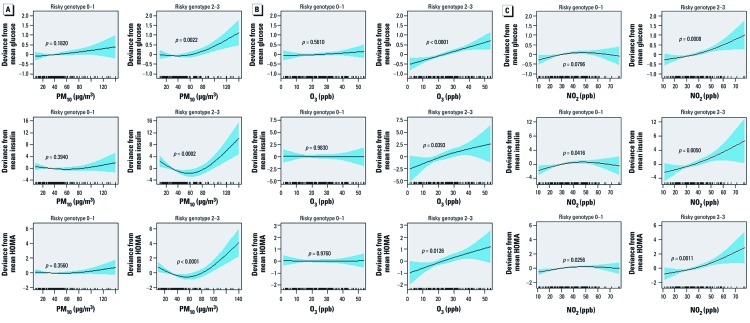
Figure 2.
Penalized regression spline of exposure to PM10 (A), O3 (B), and NO2 (C) on lag day 4, lag day 5, and lag day 7, respectively, on glucose (top), insulin (center), and HOMA (bottom) indices by 0–1 (left) or 2–3 (right) risky genotypes. Solid lines, spline curve; shaded area, 95% CI. The curves are adjusted for age, sex, BMI, cotinine level, and outdoor temperature and dew point of the day.

