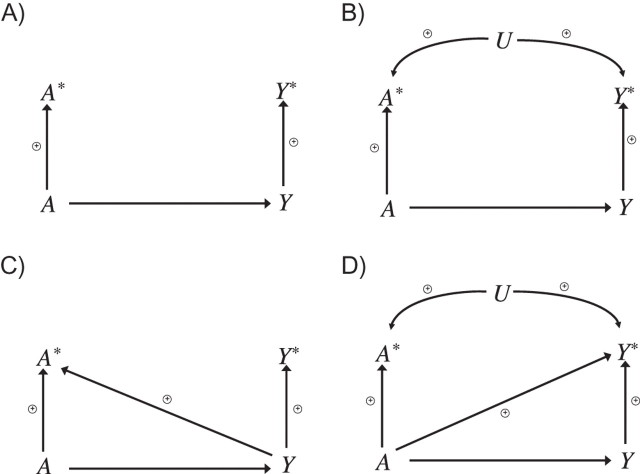
Figure 3.
Signed directed acyclic graphs illustrating generalizations of the direction-of-effect result to dependent and differential measurement error. A represents true exposure; A*, measured exposure; Y, the true outcome; Y*, the measured outcome; and U, a variable leading to correlated/dependent measurement errors. Data are available only on A* and Y*. Assuming distributional monotonicity (or binary exposure and outcome), in part A, if there is a positive association between A* and Y*, there must be a positive association between A and Y; and if there is a negative association between A* and Y*, there must be a negative association between A and Y. In parts B–D, if there is a negative association between A* and Y*, there must be a negative association between A and Y.

