
Fig. 10.
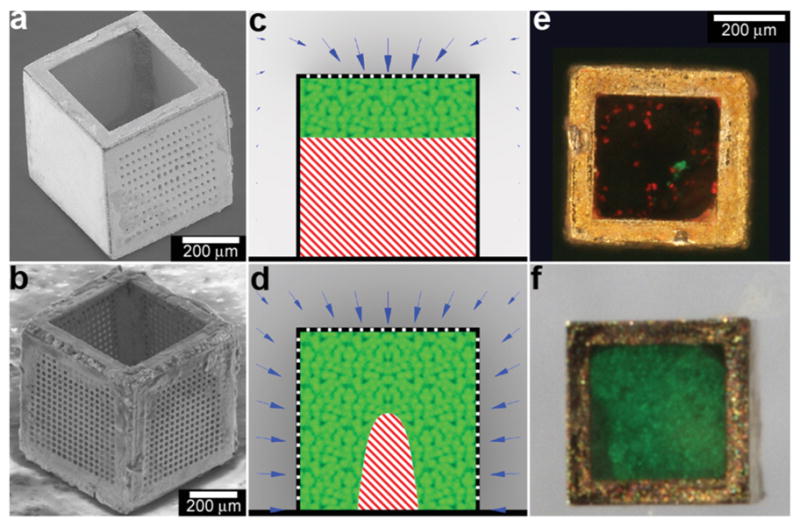
Three dimensional nutrient patterning inside polyhedral micro-containers. (a, b) Electron microscopy images of a self-assembled one porous-faced (a) and five porous-faced (b) microcontainers. The open face at the top of the containers is used for cell loading and it is sealed during the experiment. (Reprinted from ref. 115 with permission from The Royal Society of Chemistry). (c, d) Numerical simulations of spatial variation of viable (green) and necrotic (red) cells within a micro-container with (c) one porous face and (d) a microcontainer with porosity on all faces except the one at the bottom (similar to the containers shown in (a, b)). The O2 concentration outside the microcontainers is color coded with darker gray colors indicating lower O2 concentrations. The arrows represent the diffusive flux of O2 in the medium surrounding the microcontainer. (Reprinted from ref. 115 with permission from The Royal Society of Chemistry). (e, f) Representative images of 500 μm sized microcontainers with one porous face (e) and five porous faces (f) removed from the cell culture medium and opened for inspection after 7 days. Cells were stained using the live/dead (green/red) assay. Microcontainer with one porous face showed significant numbers of dead cells (e) while those with five porous faces (f) showed high cell viability. (Reprinted from ref. 115 with permission from The Royal Society of Chemistry).