Fig. 4.
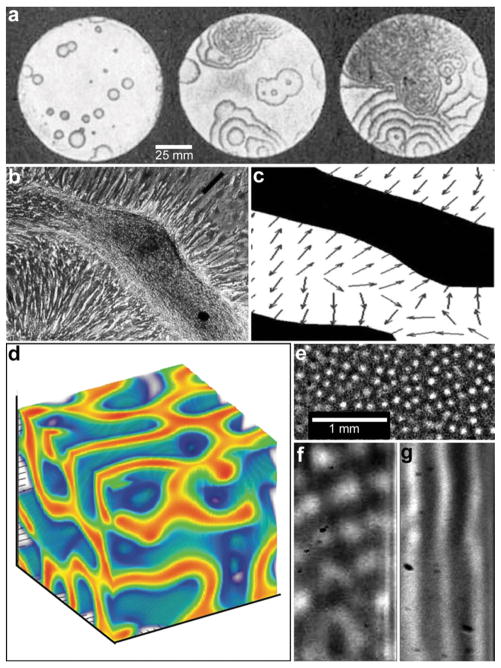
Reaction-diffusion chemical patterns in 2D and 3D. (a) Photographs of a concentration wave propagation in two-dimensional self-oscillatory chemical system. The images were taken at 4 min intervals. Ring diameter equals 100 mm. (Reprinted with permission from ref. 39. Copyright (1970) by The Nature Publishing Group). (b) Pattern formation in cultured Vascular Mesenchymal Cells (VMCs) in vitro. Over 20 days, VMCs develop from a monolayer of randomly oriented cells (not shown in the figure) of nearly uniform density to a ridge with the perpendicular orientation of cells in the monolayer relative to the edges of the multicellular ridge. The black bar in (b) shows the approximate size, shape, and orientation of a single cell. (Reprinted with permission from ref. 51. Copyright (2004) by The National Academy of Sciences, USA). (c) Numerical solutions corresponding to the experimental image shown in (b). Model results are displayed as levels of one of the chemicals involved (the activator) with black representing high and white representing low levels. Gray arrows depict the direction field of gradients of the activator concentration, which corresponds to the perpendicular orientation of cells in culture. (Reprinted with permission from ref. 51. Copyright (2004) by The National Academy of Sciences, USA). (d) 3D steady state patterns of VMCs obtained in simulations of pattern formation of the cells arising from their interaction with Bone Morphogenic Protein-2 (BMP-2) and its inhibitor, Matrix Gla Protein (MGP) in three dimensions. In 3D, the steady state patterns produced are highly interconnected tubes which have planar surfaces. (Reprinted with permission from ref. 52). (e–g) Tomographic study of the Belousov-Zhabotinsky reaction: snapshots of stationary 2D spots (e) in a thin layer and 2D images of the corresponding 3D structures (f) and (g). Bright regions correspond to high concentrations of the oxidized form of the catalyst. (Reprinted with permission from ref. 53. Copyright (2011) by The American Association for the Advancement of Science).

