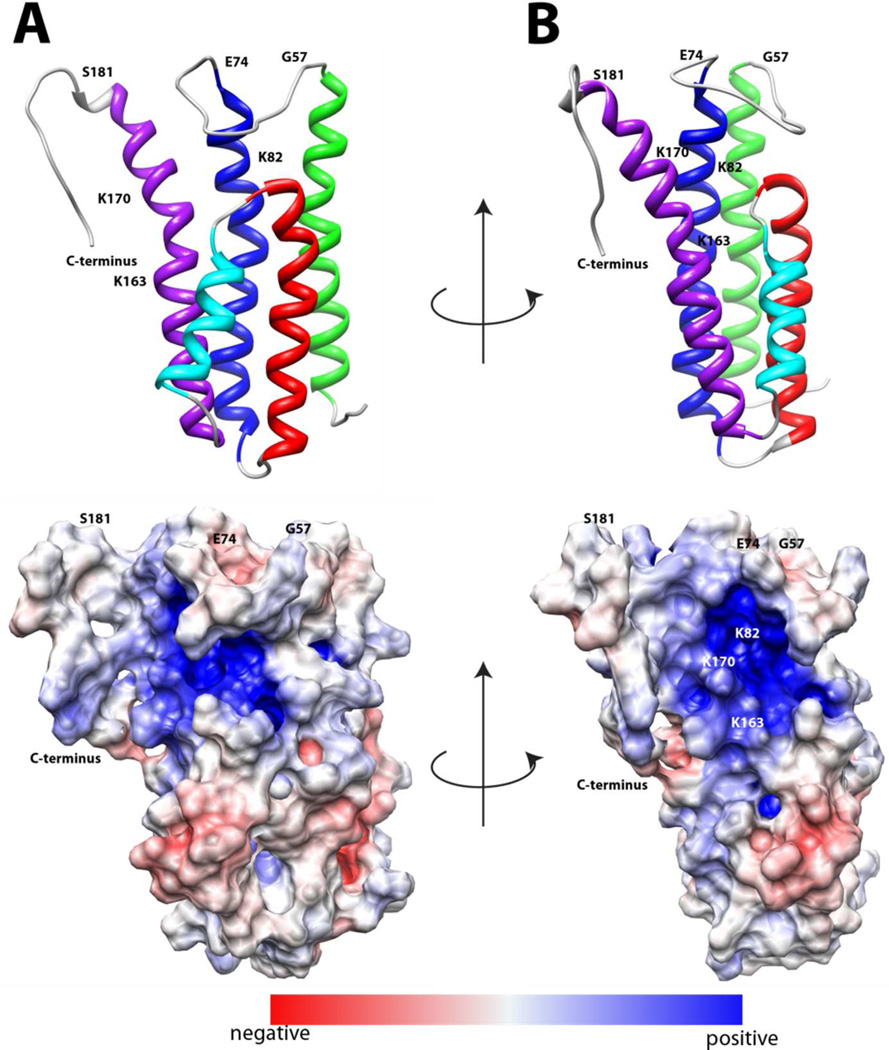
Figure 2.
Electrostatic potential surface map of DBPA in two orientations. Red indicates acidic regions and blue indicates basic regions. A) the protein is in the same orientation as figure 1A. B) the protein is rotated 90 degrees about the vertical axis.

