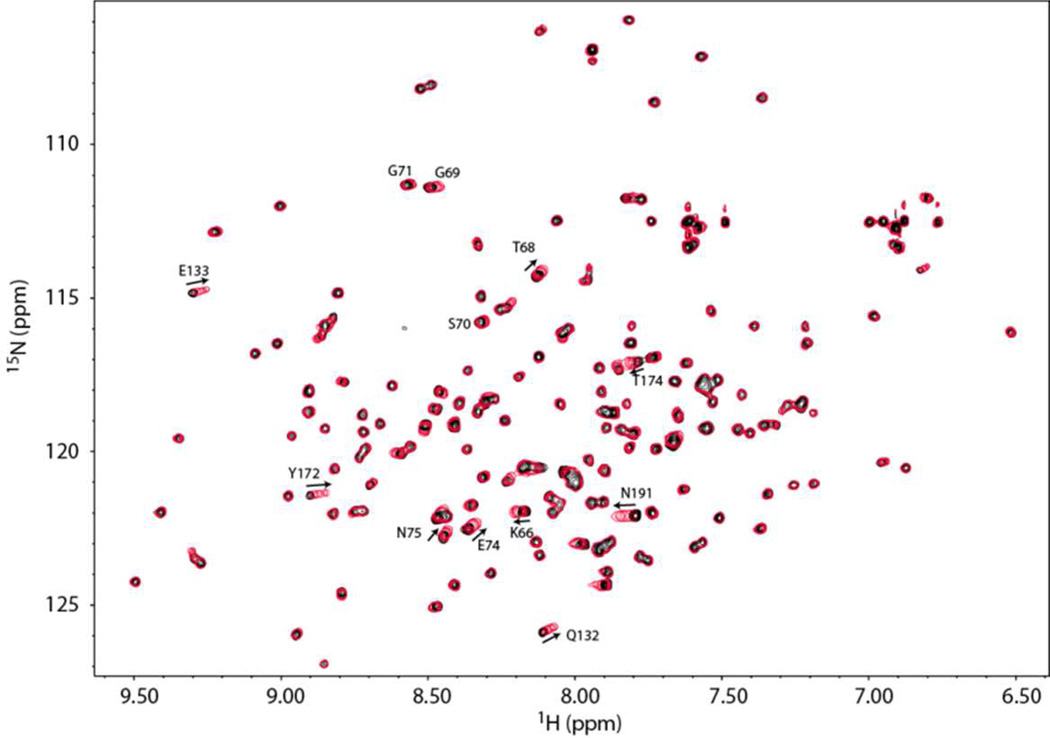
Figure 4.
1H,15N-HSQC overlays of DBPA in the presence of different concentrations of heparin dp10. Signals experiencing large migration or large increase in signal intensity (G69, S70 & G71) are indicated with residue number and direction of migration. Solid black contour represent the starting HSQC of DBPA in the absence of heparin dp10. Each subsequent red single contour represents HSQC of DBPA at a different concentration of heparin dp10. The concentrations of heparin dp10 are 0.3, 0.6, 0.9, 1.2, 1.6 and 2.0 mM. The DBPA concentration is 0.1 mM.

